Operability Kata - UK General Election 2017 Tweet Analysis with Elastic Stack
Operability Kata?
You may already be familiar with Katas, you take an arbitrary problem and practice your skills around it. You often repeat the same one to focus on how you approach the problem, not the actual problem itself. But why focus only on writing code? Skills such as analysing logs and finding insight from a large sea of data is vital to supporting services in live. After all, aggregating the logs is only half the challenge, do you have the skills to get what you need out of them?
As part of talks for several local user groups on Log Aggregation, I often collect arbitrary data sets (Walking Dead/Game of Thrones premieres, finales) and used this for live demos. But can be it be valuable to take arbitrary data sets and practice log/data analysis skills on them, just as a learning experience?
Disclaimer: I am not a political expert, this data is not representative, trying to read too much into its politics is ill advised
The Data Set
Here in the UK, we just had a general election, because you can never have too much politics. But when politics looks like the header image it's hard to complain too much.
9pm the day before the election, I started collecting tweets with the following keywords: corbyn, theresamay, #ge2017, #generalelection2017. The two leaders of the UK's main parties and what I could see at the time as the "official" hashtags of the general election (if such things can be official).
The Goal
Take the General Election twitter data set, and attempt to find changes in behavior, insight or interesting facts from the data. Where possible link changes in data with known events.
Summary of the How
Setting up an Elastic Stack and getting data in is several large blog posts in itself, so suffice to say that I setup a single Elasticsearch node, one Logstash and a Kibana instance to handle the job at hand, all managed via Rancher/Docker for ease of setup.
To get the data in I have an application I wrote years ago to connect to a Twitter Stream, run the sentiment analysis and send it to Logstash: TweetSteamToLogstash.
So what does the data tell us?
Quantity
Overall tweets peaked at 10pm on the day of the election, around 164,000 tweets in a single hour - this is when the polls closed and the Exit Poll is released. Before this point it was widely accepted that it was going to be an easy win for the Conservatives, the Exit Poll saying a hung parliament (no party with an overall majority) was therefore quite a shock.
Corbyn vs. May
Corbyn commands a significant lead in terms of tweet quantity throughout the process, but more people are tweeting about the election in general than either leader.
Tweets of labour vs conservatives is much more evenly split, with more people referencing corbyn specifically than mentioning the labour party itself. Obviously the party names weren't part of the keyword set, so we're only picking up people who mention one of the other keywords and the party name as well, but it should work the same for both parties.
Anomaly No. 1
Looking at the last two graphs I noticed a difference in the "Other" data, i.e. not labour/conservatives/party leader. Friday morning people were talking about a party that isn't Labour or Conservative, who is it and what happened?
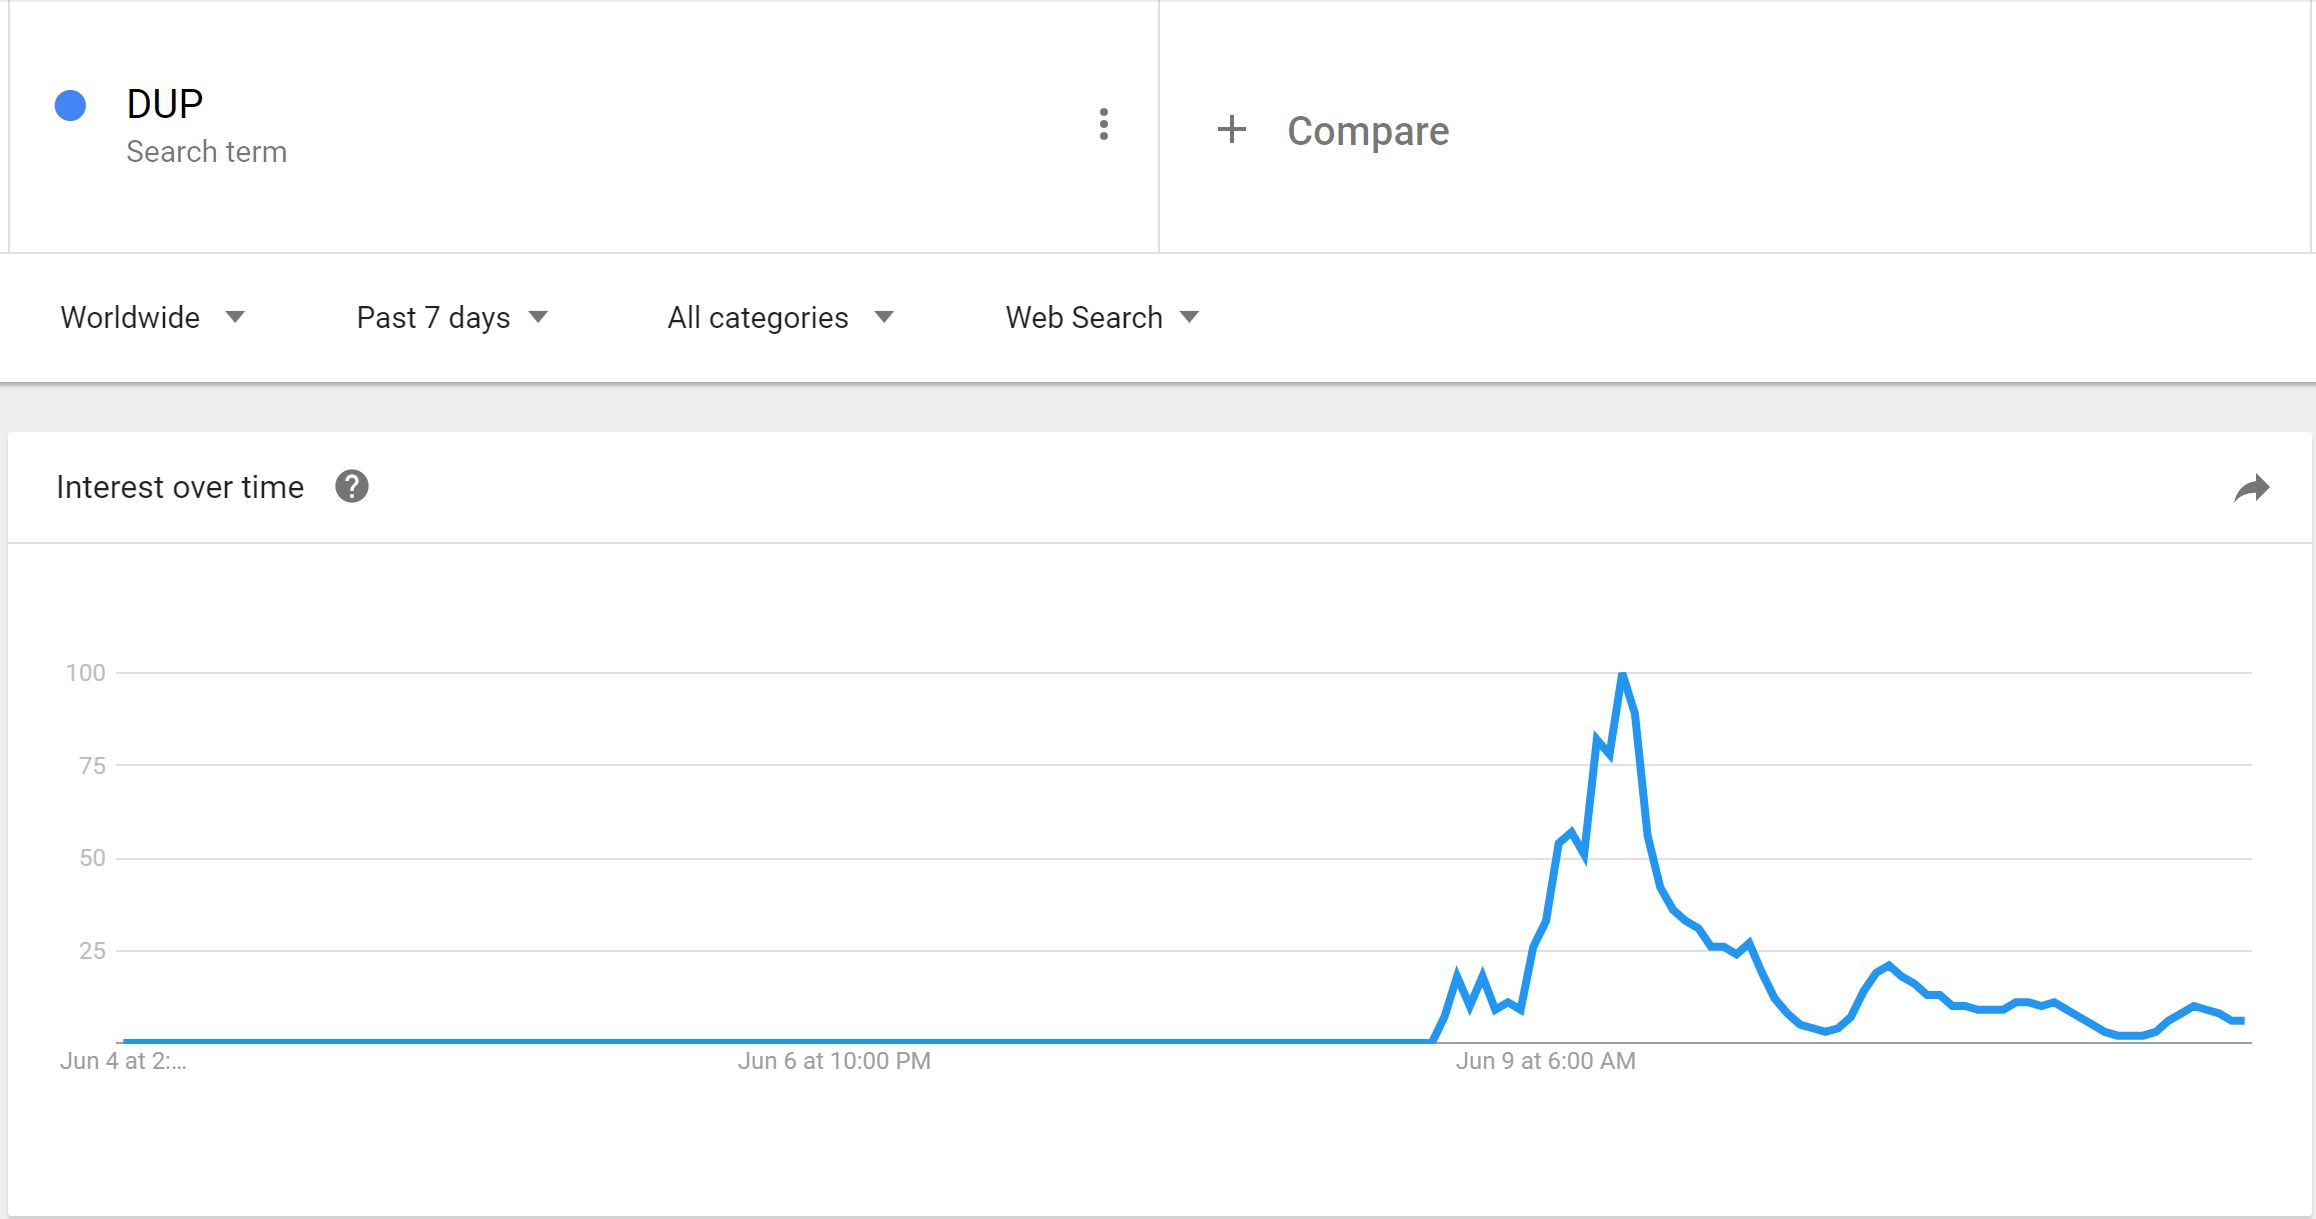
June 9th, at 9am suddenly a large number of people start talking about the DUP, a smallish party in Northern Ireland, which as you can see, previous to this point, rarely got a look in or mention. What happened? News broke that they were being placed as kingmakers in the minority government for the conservatives to maintain a majority. Suddenly a lot of people were very interested in the DUP:

Anomaly No. 2
The second anomaly I spotted was at 9pm on 9th June, DUP was continuing it's downwards trend after their appearance from no where but conservative and labour had a brief resurgence, can we work out what happened then?
Zooming in the graph doesn't help matters much, the spike in interest lasts a brief 30minutes, so lets see what people were saying during that window.
A terms aggregation suggests the top tweet during the period of 9pm to 10.30pm was to do with the general election, teen choice and the NBA Finals, a certainly odd combination. Then some rather more logical tweets about politics. But these tweets were happening for some time, they don't seem unusual for just this time period, we don't necessarily want to know what was most popular, but what was most popular significantly for this time period.
A significant terms aggregation shows not what is most popular, but what is proportionally more popular within a filtered aggregation than the wider population. So by filtering the data by a wider time period, applying a filter aggregation for the time period we care about and then a significant terms aggregation. As you can see above, everything returned by the significant terms aggregation was related to Kensington - Labour taking it was another unexpected result and was announced at 9pm.
Sentiment
So we know when people were tweeting, and what caused that to change, but can any insight be gained from the sentiment of those tweets? Are labour or conservative tweets more positive? Was anyone happy about a hung parliament?
Part of the ingestion applies a sentiment analysis on the tweet content - this splits the tweet into tokens and then finds ones with positive or negative meaning, and adds them together to find a figure for the ultimate sentiment. It's basic, but it gives a general feeling for the types of word being used.
Let's start off with the sentiment of each leader. Corbyn's red line tracks closely with overall sentiment of the general election, just about positive. Theresa May fares poorly, generally negative, and getting worse at midday on the 9th. What happened then?
If we ignore retweets (NOT RT), then we don't see the same pronounced drop off in sentiment for Theresa May:
So the negative tweets are a RT spreading quickly at that point, lets have a look at the significant terms tweets, focused on when the sentiment drops.
Oh dear, it appears it took a few hours for people to get good and angry about the Conservatives working with the DUP - the tweets significant for the period of Theresa May's tweet sentiment dropping (12pm - 4pm) are all to do with DUP and terrorism.
Sadly, as I didn't enable fielddata on the tweet content, I couldn't analyse which words were being used for various tweets as I have previously, definitely something I need to remember when using Elasticsearch 5.x.
In Summary
What did I learn?
So in kata's spirit of learning and iterating, what did I learn this time that I would do differently next?
- Store more tweet data - I didn't have a chance to update TweetStreamToLogstash to do geo location if available, I think this would have been an interesting extra dimension to the data analysis. Ultimately I want to move the sentiment analysis functionality into a Logstash filter, but i have to build myself up to writing some ruby first.
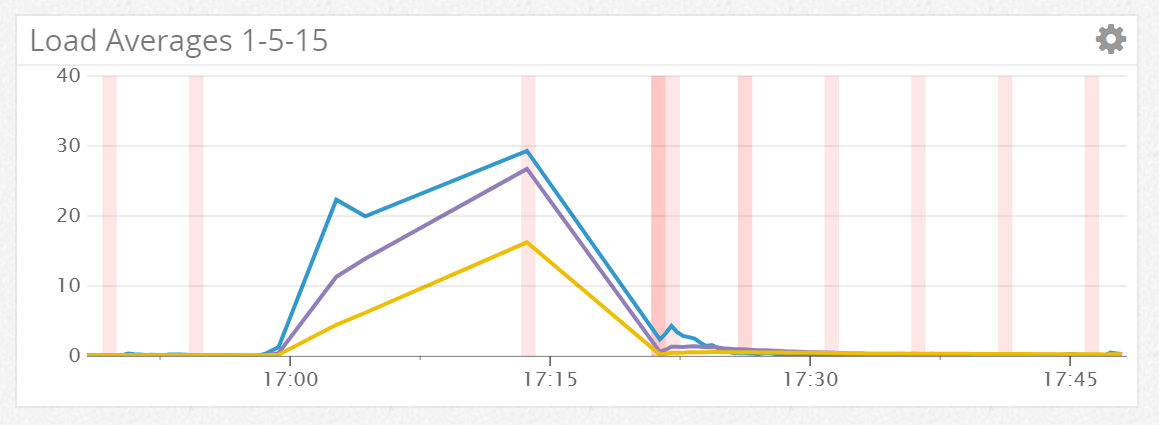
- Poor little Elasticsearch Node - It turns out that was quite a lot of data for one $10 vultr node, I pushed it over the edge several times in the course of the data analysis (Load average of 30 for a 1 core machine is not recommended)
- Elasticsearch 5 changes - This was an omission on my part, but I'd forgotten to set the text fields (non-keyword analysis of string field mappings in Elasticsearch) to enable fielddata, meaning that I could not aggregate on the tokenised version of the tweet content. I can rectify this by re-indexing into another Elasticsearch index so that I can change the mappings of the particular type, but I'll leave that for another day and blog post.
Operability Kata - did it work?
Did I find the exercise useful? Exploring this data provided some unique challenges not usually present in web server/application log analysis. I got to use in anger some tools I hadn't used a great deal (Kibana/Elasticsearch 5.x), and I got reuse some skills I'd used before in a more relaxed environment - usually if I'm using significant terms on log data, it's because something bad has happened and I've no idea what it is.
Would it be worthwhile reusing the same data set? Possibly - especially once I've re-indexed it with fielddata enabled for the tweet content. Other data sets would also be good to look into. Comparing the skills and techniques I used to analyse the tweets to those I've used for proxy/application logs in the past, there were a lot of parallels, determining where the anomalies are and what triggered them, removing noise, are all skills that are key when trying to determine root cause on an issue, live or retrospectively. The anomaly detection side of thing I'd also really like to explore bringing in the new Machine Learning or graphing capabilities of Elasticsearch in future exercises.
But I'm also interested in the other directions an Operability Kata could take. Be it configuration management, secret management, provisioning servers - there's lots of techniques that I only try out when I need to build something new, or just haven't got round to. Practicing these things seems as key as practicing writing better code. I'm not certain what form these other katas could take, log data analysis is quite easy as the data is easily available, and exploring that data is in itself, the challenge - but can we easily do the same for other areas?
Back to politics?
As for political analysis? If I were to judge the winner of the night? I'd have to say Lord Buckethead, without hesitation:


